
Introduction:

In the realm of modern manufacturing, the pursuit of excellence extends beyond production quotas and profit margins. The integration of Environmental, Health, and Safety (EHS) practices has become imperative, fostering a culture of well-being and sustainability. I try to delve into the world of EHS metrics, explore the concept of leading and lagging indicators, and provide real-world examples of their implementation in manufacturing facilities as well as tie up Metrics to the Balance Score Card for the EHS Metrics for a holistic approach to EHS implementation.
Metrics and Indicators:
Metrics and indicators are terms often used in various fields, including business, finance, and performance measurement. While they are related, they have distinct meanings and serve different purposes.
Metrics:
A metric is a quantitative measurement or standard used to assess, track, and evaluate a specific aspect of performance or a particular process. Metrics provide objective data that can be analysed to gauge progress, efficiency, quality, or any other measurable attribute. Metrics are typically numerical in nature and help organizations understand how well they are meeting their goals or objectives.
For example, in the context of EHS (Environmental, Health, and Safety), some metrics could include:
Total energy consumption per unit of production.
Number of workplace injuries in a given period.
Amount of waste generated per MT product manufactured
Indicators:
An indicator, on the other hand, is a specific value or piece of information that serves as a signal or sign of a larger trend, condition, or performance level. Indicators are often used to convey complex information in a more understandable and easily interpretable manner. They provide insight into a situation or phenomenon, allowing decision-makers to make informed judgments.
In the EHS context, indicators might include:
Leading Indicator: The percentage of employees who completed safety training.
Lagging Indicator: The number of lost workdays due to workplace injuries.
Environmental, Health, and Safety Metrics:
EHS metrics serve as the compass guiding manufacturing facilities toward a safer and more sustainable future. These metrics encapsulate a wide array of parameters, from tracking energy consumption to monitoring air quality and ensuring worker safety. Let’s take a look at some key EHS metrics:
Energy Consumption: Tracking energy usage per unit of production can highlight inefficiencies and drive efforts to reduce energy consumption. A reduction in energy consumption not only benefits the environment but also leads to cost savings.
Waste Generation and Recycling Rates: Calculating the amount of waste generated and the percentage that is recycled showcases a facility’s commitment to minimizing its environmental footprint.
Lost Time Injury Rate (LTIR): This lagging indicator quantifies the number of work-related injuries resulting in lost workdays. A lower LTIR indicates a safer work environment.
Near-Miss Reporting: Leading indicators like near-miss reports provide insights into potential hazards that can be addressed before an incident occurs. Encouraging employees to report near-misses fosters a proactive safety culture.
Leading and Lagging Indicators in Manufacturing:
Understanding the distinction between leading and lagging indicators is vital for a well-rounded EHS strategy. While lagging indicators offer retrospective insights, leading indicators empower proactive decision-making. Here’s how they work together:
Lagging Indicators: Consider a manufacturing facility that experienced a series of chemical spills over the past year. By analysing historical data, the facility can identify trends and develop targeted interventions to prevent future spills.
Incident Severity Rate (Lagging Indicator): After a machinery malfunction led to an injury, the facility investigates the incident’s severity rate – the number of days affected employees spend away from work. This lagging indicator prompts corrective action to prevent future incidents.
Total Recordable Incident Rate (TRIR): TRIR calculates the number of work-related injuries and illnesses per a certain number of hours worked, providing insight into overall safety performance.
Lost Workdays Case Rate (LWCR): LWCR measures the number of workdays lost due to injuries or illnesses, indicating the severity of incidents and their impact on productivity.
Occupational Illness Rate: This metric quantifies the number of confirmed occupational illnesses within a given time frame, shedding light on long-term health risks.
Environmental Compliance Violations: Tracking instances of environmental non-compliance, such as spills or emissions exceeding permitted levels, highlights potential environmental risks.
Downtime Due to Safety Incidents: Measuring the amount of production downtime resulting from safety incidents reveals the financial impact of inadequate safety measures.
Number of Injuries by Type: Analyzing the specific types of injuries (e.g., slips, trips, falls) can help target preventive measures and safety training.
Severity of Injuries: Tracking the severity of injuries (minor, moderate, severe) provides insight into the impact of incidents on employees’ well-being.
Leading Indicator Examples: Imagine a manufacturing plant implementing regular safety training sessions for its employees. As employees become better educated about potential hazards, the frequency of safety incidents may decrease, leading to improved lagging indicators over time.
Training Completion (Leading Indicator): A manufacturing company introduces mandatory safety training modules for all employees. An increase in the percentage of completed training indicates a proactive approach to safety.
Percentage of PPE Compliance (Leading Indicator): Monitoring the consistent use of personal protective equipment (PPE) by workers can serve as a leading indicator of a strong safety culture.
Emergency Response Time (Leading Indicator): By tracking the time taken to respond to emergency situations (e.g., chemical leaks or fires), a manufacturing plant can continuously refine its emergency protocols.
Near-Miss Reporting Rate: The frequency at which employees report near-miss incidents or potential hazards can indicate a proactive safety culture and a focus on prevention.
Safety Training Hours: Monitoring the number of hours employees spend in safety training sessions demonstrates a commitment to educating the workforce about potential risks.
Safety Observation Cards: Encouraging employees to regularly submit safety observation cards helps identify at-risk behaviors or conditions, allowing for timely corrective actions.
Safety Committee Activities: Tracking the number of safety committee meetings and the implementation of their recommendations indicates active involvement in safety improvement initiatives.
Hazard Identification and Risk Assessment (HIRA) Frequency: Regularly conducting HIRAs to identify and assess workplace hazards demonstrates a systematic approach to risk management.
Ergonomics Assessments: Conducting ergonomic assessments and implementing ergonomic solutions based on the assessment findings can lead to reduced workplace injuries.
Participation in Safety Drills: The level of employee participation and engagement in safety drills, such as fire drills or emergency evacuation drills, indicates preparedness for real emergencies.
Here are additional leading indicators for various aspects of EHS, including energy, occupational health, sustainability, and audits:
Energy:
Energy Efficiency Projects Implemented: Tracking the number and impact of energy-saving initiatives, such as lighting upgrades, equipment optimization, and process improvements, demonstrates a commitment to energy efficiency.
Energy Consumption Trend Analysis: Regularly analyzing energy consumption data to identify patterns, anomalies, and potential areas for optimization can lead to proactive energy management.
Renewable Energy Adoption: Monitoring the proportion of renewable energy sources (solar, wind, etc.) in the overall energy mix indicates progress towards sustainable energy practices.
Real-time Energy Monitoring: Implementing real-time energy monitoring systems to track energy use across different production lines or shifts allows for timely adjustments and energy savings.
Occupational Health:
Employee Health and Wellness Programs Participation: The level of engagement in health and wellness programs, such as fitness activities, ergonomic workshops, and stress management seminars, reflects a focus on employee well-being.
Ergonomic Improvements Implemented: Tracking the implementation of ergonomic recommendations and solutions from assessments can lead to reduced workplace injuries and improved employee comfort.
Health Check-Up Completion Rate: Encouraging regular health check-ups for employees and monitoring the percentage of participation helps detect health issues early and supports preventive healthcare.
Personal Protective Equipment (PPE) Compliance: Regularly assessing the proper use and availability of PPE indicates a commitment to maintaining a safe work environment.
Sustainability:
Waste Reduction Initiatives: Measuring the number and impact of waste reduction projects, such as recycling programs or waste minimization efforts, demonstrates progress toward sustainability goals.
Carbon Footprint Reduction Targets: Tracking progress toward reducing the facility’s carbon footprint through measures like energy efficiency and emission reduction initiatives showcases commitment to environmental sustainability.
Supplier Sustainability Assessments: Regularly evaluating the sustainability practices of suppliers and partners ensures alignment with your organization’s environmental goals.
Water Usage Optimization: Monitoring water consumption and implementing strategies to reduce water usage, such as process improvements and leak detection, contributes to water conservation.
Audits and Compliance:
Audit Completion Rate: Tracking the frequency and completion of internal and external audits demonstrates diligence in evaluating EHS practices and regulatory compliance.
Corrective Action Timeliness: Monitoring the time taken to address findings from audits and inspections reflects the organization’s responsiveness to identified issues.
Training on Regulatory Changes: Ensuring employees receive training on new regulations or compliance requirements demonstrates proactive efforts to stay up-to-date with changing EHS standards.
Continuous Improvement Initiatives: Tracking the implementation and effectiveness of improvement actions resulting from audit findings showcases a commitment to ongoing enhancement of EHS practices.
Process Safety:

Here are some examples of process safety leading indicators:
Near-Miss Reporting Rate: The frequency of reporting near-miss incidents or close calls can indicate an active reporting culture and highlight potential hazards before they result in actual incidents.
Process Hazard Analysis (PHA) Completion Rate: Tracking the timely completion of PHAs, such as Hazard and Operability Studies (HAZOP) or What-If Analysis, ensures that potential hazards are thoroughly evaluated.
Management of Change (MOC) Review Cycle Time: Monitoring the time taken to review and approve changes to processes, equipment, or procedures helps ensure thorough evaluation before implementation.
Emergency Response Drills Participation: Regular participation and engagement in emergency response drills and simulations demonstrate preparedness for process safety incidents.
Process Safety Training Hours: Measuring the amount of time employees spend on process safety training reflects the organization’s commitment to educating the workforce about potential risks.
Safety Culture Surveys: Conducting periodic surveys to assess employees’ perceptions of process safety culture can help identify areas for improvement and track cultural shifts.
Mechanical Integrity Audit Results: Tracking the outcomes of audits focused on equipment integrity and maintenance practices provides insights into potential vulnerabilities.
Process Safety Leading KPIs: Developing specific Key Performance Indicators (KPIs) related to process safety, such as “percentage of critical equipment inspected,” provides targeted insights into process safety performance.
Process Safety Committee Activities: Monitoring the frequency and effectiveness of process safety committee meetings and their recommendations indicates active involvement in process safety improvement.
Operational Readiness Checks: Verifying that safety-critical systems and safeguards are functioning as intended before starting a new process or after maintenance helps ensure safe operations.
EHS Balance Scorecard:
An EHS (Environmental, Health, and Safety) Balanced Scorecard is a strategic management tool that provides a comprehensive and balanced view of an organization’s performance in the areas of environmental, health, and safety and its compliance. It integrates key performance indicators (KPIs) from various aspects of EHS management to measure progress, align actions with strategic objectives, and drive continuous improvement. The EHS Balanced Scorecard is derived from the concept of the balanced scorecard, which was originally developed by Kaplan and Norton to assess overall organizational performance.
The EHS Balanced Scorecard typically includes a combination of leading and lagging indicators that reflect different dimensions of EHS management. Here’s how it ties into EHS metrics:
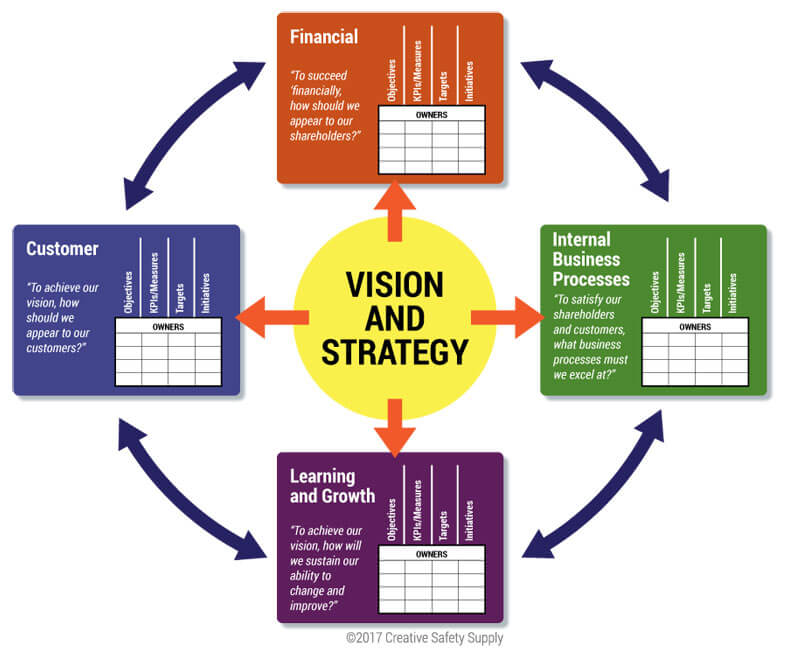
Financial Perspective: This perspective involves quantifying the financial impact of EHS initiatives. Metrics here could include cost savings from energy efficiency projects, reduction in insurance premiums due to improved safety records, or savings from waste reduction and recycling efforts. While EHS may not have direct financial gains in the short term, it can lead to cost savings, avoidance of fines, and improved brand reputation in the long run. Metrics here might include:
Cost of Compliance: Measures expenses related to ensuring compliance with EHS regulations.
Risk Avoidance: Quantifies the financial impact of avoiding EHS-related incidents.
Customer Perspective: While the primary focus of EHS is internal, customer perspectives can still apply. For instance, metrics might involve customer satisfaction with the organization’s commitment to sustainability, transparency about environmental impact, or health and safety practices when products are used. EHS practices can enhance a company’s reputation and attractiveness to environmentally conscious customers. Metrics in this perspective could include:
Environmental Product Attributes: Measures the incorporation of environmentally friendly features into products.
Customer Satisfaction with Sustainability Practices: Gauges customer perceptions of the company’s commitment to EHS.
Internal Processes Perspective: This perspective centers on the organization’s internal EHS processes. Metrics could include the percentage of employees trained in safety procedures, the frequency of safety audits, and the efficiency of waste management and disposal processes. This perspective focuses on the internal processes that directly impact EHS performance. Metrics could encompass:
Incident Response Time: Measures how quickly the company responds to incidents or near-misses.
Hazard Identification Rate: Tracks the frequency of hazards identified and addressed.
Learning and Growth Perspective: In the context of EHS, this perspective focuses on the development of the workforce and the organization’s capacity for improvement. Metrics might involve the number of employees engaged in EHS committees, the level of employee participation in safety drills, and the rate of adoption of new safety technologies.
The EHS Balanced Scorecard enables organizations to:

Measure Holistic Performance: By including a mix of leading and lagging indicators, the scorecard provides a comprehensive view of EHS performance, ensuring that improvements in one area do not come at the expense of others.
Align with Strategy: The scorecard helps align EHS initiatives with the organization’s overall strategic objectives. For instance, if a company aims to reduce its carbon footprint as part of its sustainability strategy, the EHS Balanced Scorecard could track metrics related to energy consumption, emissions reduction, and waste reduction.
Drive Accountability: By setting specific targets for each perspective and tracking progress over time, the EHS Balanced Scorecard promotes accountability among different departments and levels of the organization.
Facilitate Communication: The scorecard serves as a communication tool, allowing stakeholders to understand the organization’s EHS efforts at a glance and fostering transparency.
Support Decision-Making: The data collected through the scorecard can inform data-driven decision-making, enabling organizations to allocate resources effectively and prioritize initiatives based on their impact.

Ultimately, the EHS Balanced Scorecard provides a structured approach to managing EHS performance, fostering a culture of continuous improvement, and ensuring that environmental, health, and safety considerations are integrated into the core of the organization’s operations. Incorporating the EHS Balanced Scorecard into an organization’s management approach ensures that EHS objectives are not isolated but are integrated into the broader strategic framework. By aligning EHS metrics with each perspective, organizations can better understand the interplay between EHS efforts and overall organizational success. This holistic approach fosters a culture of continuous improvement, accountability, and sustainability throughout the organization.
B Karthik.11th Aug 2023
Images are from WWW. (Owner’s credit).
